
Water Year 2026 Upper Klamath Lake Keno outflow Klamath Falls updating…
Water Year 2027 began October 1. The supply and accountability figures below have reset for the new water year. The 2026 irrigation season is finishing — final deliveries typically run into mid-to-late October.

Water Year 2026, against sixty-five years of record

The Project put more water past Keno than nature did in most years.

Snow and spring runoff fill Upper Klamath Lake behind the natural reef at Link River.

Without the Project, that water spilled over the reef mostly in winter and spring. It then crossed a Lower Klamath Lake of open water and tule marsh that consumed much of it before it ever reached Keno. The natural river ran hardest in May. By September it had fallen to almost nothing.

The Project stores that water, delivers it to farms above Keno, and pays the rest over Keno Dam through the months the natural river was drying up. Across sixty-five years of gaged record the river below Keno carried on average 199,944 AF a year more than the natural lakes would have passed — because the natural system evaporated roughly a quarter of its supply off Lower Klamath Lake before the water ever got there.

Here is that record — and how the c’waam and koptu in the lake above, and the salmon in the river below Keno, are faring in it.

Water Year 2026 · net inflow to Upper Klamath Lake 752,264 AF this water year to date, from 1 October · about 63% of an average year (~1.2 MAF long-term average)
~161,000AF delivered to Project farms
542,572AF passed over Keno so far this water year
47,430AF returned to the river to support targeted Keno flows
The short version

Before the Klamath Project, the river’s water crossed a wide, shallow lake on its way south, and roughly a fifth of it evaporated before it ever reached the town of Keno.

That lake was drained a century ago, so the water that used to disappear now stays in the river.

The Project also changed when the water arrives: the wild river ran hard in May and nearly dried up by September, while the Project holds water back in spring and lets it out through the summer.

Across 65 years of measurements — a span that takes in the Christmas flood of 1964 and all the years of irrigation from 1889 to today — the river below Keno carried more water than it would have without the Project in 51 of those years.

Since 2001, under a series of federal biological opinions, the river, the lake and the farms have all received less than they did before — the farms most of all.

Where the water goes

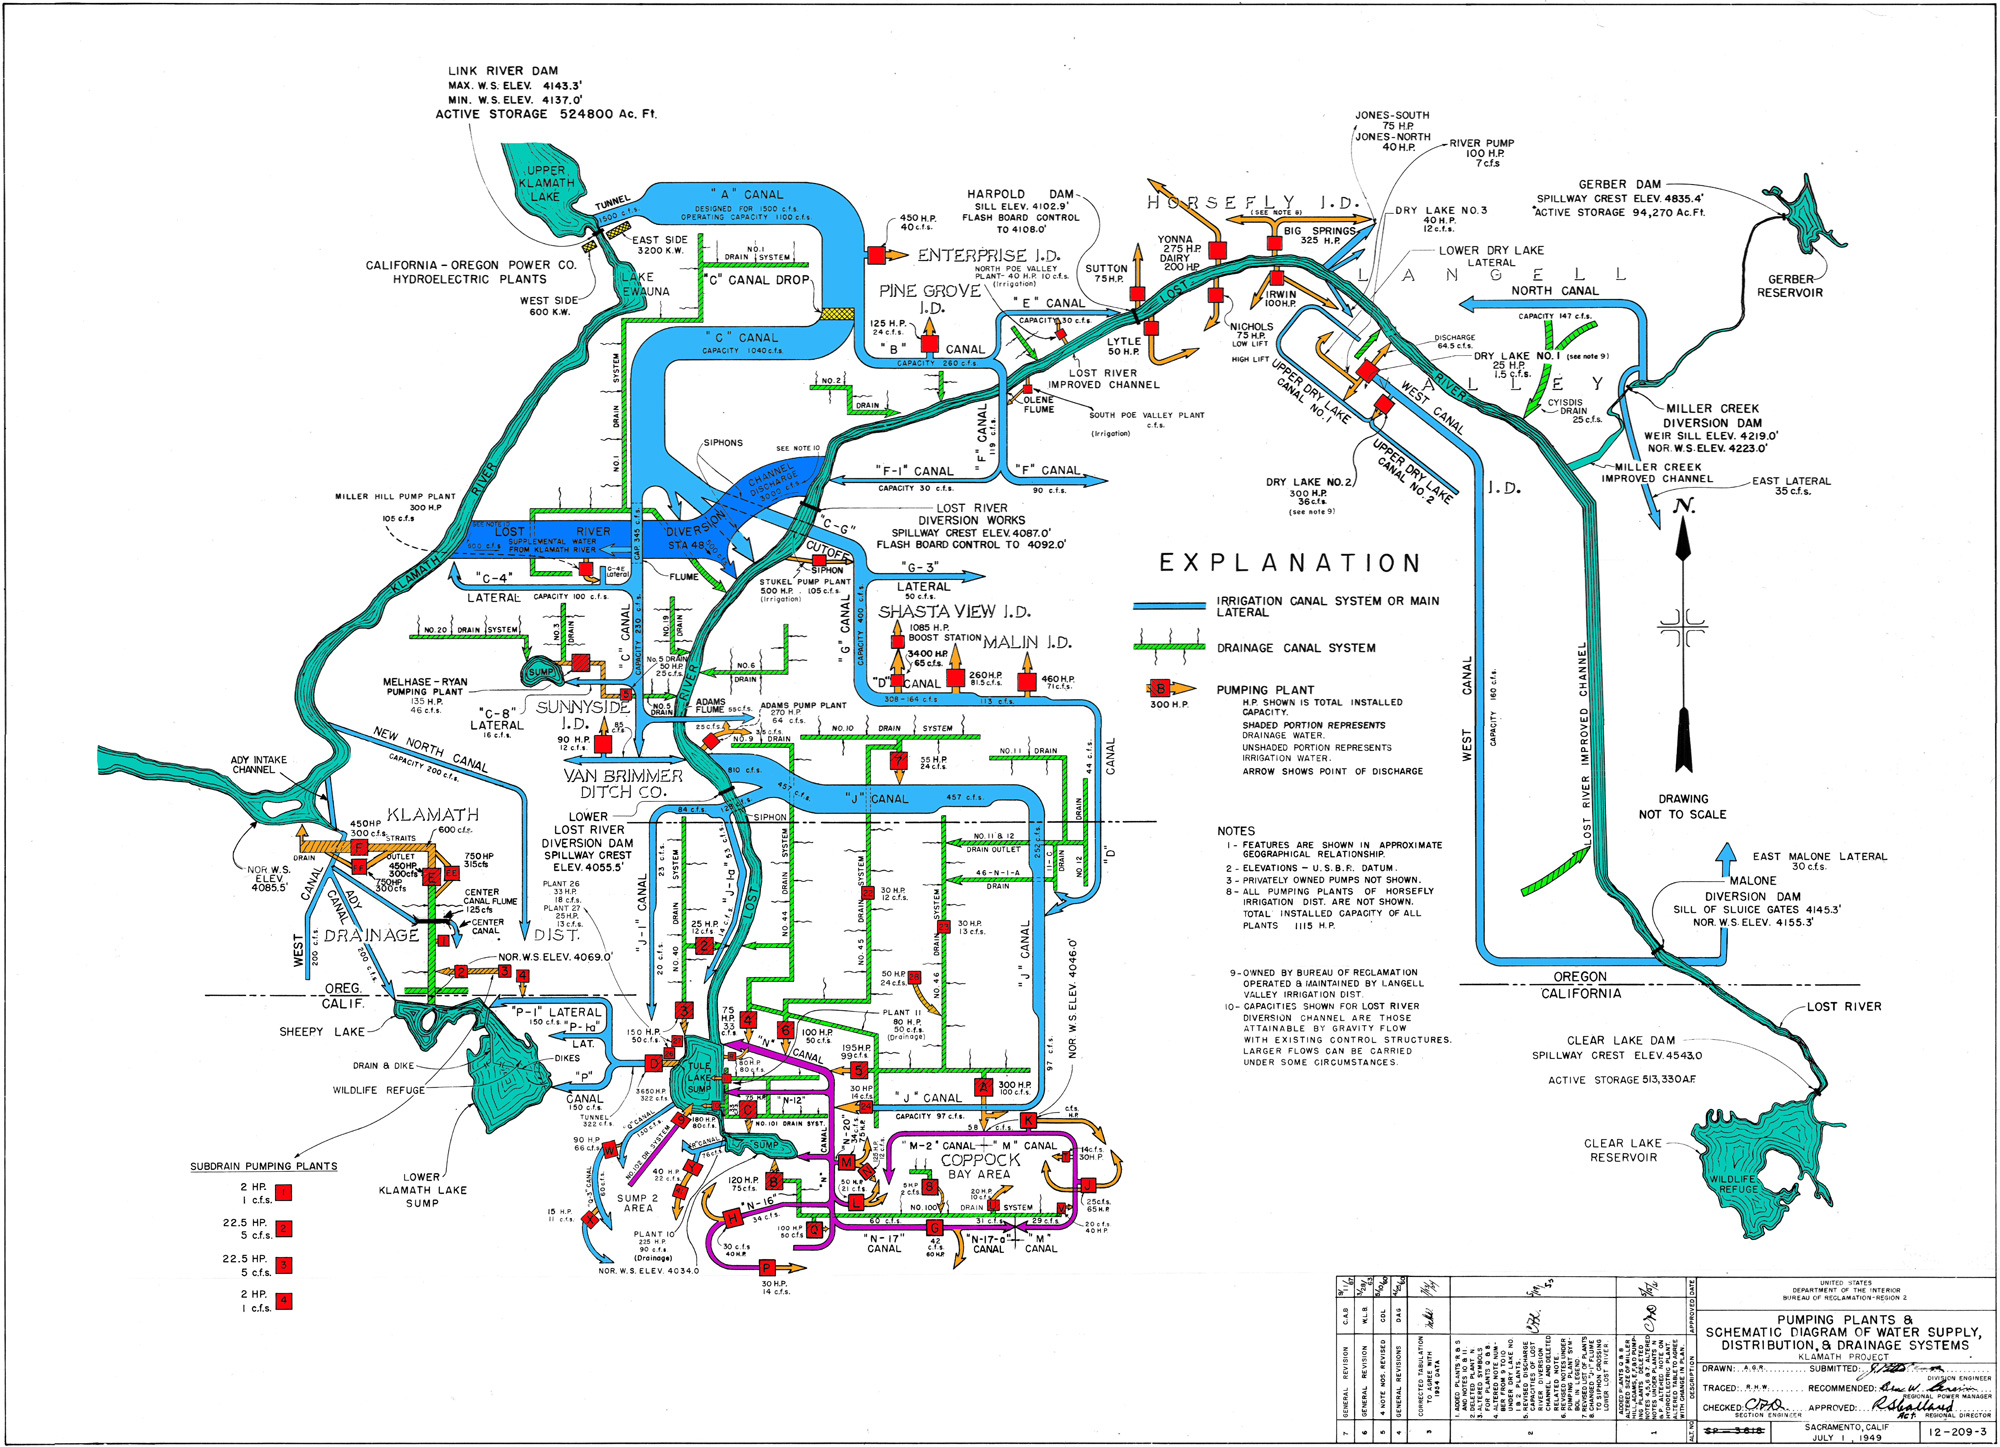
snow and spring runoff collect here Upper Klamath Lake Link River Dam the only control on the lake Ewauna “A” Canal drawn from the lake the natural river spread south from here into Lower Klamath Lake the Klamath Straits the lake’s natural outlet then, and the Project’s return route now Keno Dam on the old Keno reef · everything measured here Klamath River to the Pacific · 254 miles Klamath Reclamation Project farms and refuges · Oregon and California Lower Klamath Lake drained in the 1920s by Congressional authorization and direction the lake once evaporated about a fifth of the basin’s supply · the Project now farms its bed, and reaches well beyond it

Simplified after Reclamation drawing 12-209-3 (1949); not to scale, and the canal and drain network is far denser than shown. For the full Project see Reclamation’s Klamath Basin Area Office maps, which include the Project and irrigation districts, the wider river basin, and the Project area as it stood in 1905.

AF — an acre-foot, enough water to cover an acre a foot deep. About what a Klamath family farm uses over 45 to 60 days.

cfs — cubic feet per second, a rate of flow rather than a quantity: how fast the river is running past a point.

Left to nature, in Water Year 2026 about 180,717 AF of that inflow — 24% of the year’s usable supply above Keno — would never have reached the Klamath River. It would have evaporated off Lower Klamath Lake and been transpired by the 55,842 acres of tule marsh the Keno and Snowgoose reefs kept flooded. Set against the whole river that is a small figure: at Klamath River near Klamath, nine miles above the mouth, the U.S. Geological Survey measured an average of 14,700 cfs — about 10.6 million AF a year, making the lake’s evaporation roughly 1.7% of what the Klamath carries into the Pacific. A further 15,501 AF would have gone out of the basin through the Lost River Slough.

The management

The Project re-times the year.

The clearest thing in the record is when the water moves, not how much. Across 65 reconstructed years the natural river ran hardest in May — a median of 2,349 cfs at Keno — then fell away to 558 cfs by September in a typical water year. That is the median; the mean is 618. In the driest tenth of years September ran 258 cfs, and in the driest year on record the reconstruction falls to 105 cfs — with a single day at 102. Anyone modelling from these figures should take the percentile, not the middle. What the Project does is store that water. When it is not needed for irrigation it can be released through drought and low-flow periods to hold up flows at Keno where live flow alone would not, and to approach the minimum summer and autumn flows the natural river carried — though no water right presently authorises releases of stored water for that last purpose.

Nature would have run most of this water off in the winter melt, and much of the rest would have evaporated from the natural lakes before reaching Keno. The Project holds it back and pays it out through the dry months. On the annual total for Water Year 2026 it is on course for 24,401 AF more over Keno than the natural lakes would have released — about 3% of the year’s supply, and a projection to 30 September rather than a measurement.

Held behind Link River Dam. Against what the two natural lakes would have passed over their rock reefs, the river below Keno runs below nature through winter and spring while the lake fills, and above it from midsummer on, when the natural river would have fallen away to little or nothing. The annual figure is a projection to 30 September; the seasonal pattern is what the record supports most firmly.

The fish the law protects

Salmon downriver, and the c’waam & koptu in the lake.

Downriver. Live temperature and oxygen at Keno show the conditions salmon meet today. What the sixty-five-year record shows is that the natural river was hardest on them in exactly the months that matter most. The median natural year ran 1,233 cfs in July, 721 in August and 558 by September. In the driest tenth of years those figures fall to 658, 350 and 258 cfs, and in the driest year on record the reconstruction reaches 116 cfs. On 169 days of the year the natural river’s driest tenth ran under 500 cfs.

Set against that, Reclamation’s 2024 Proposed Action holds a floor near 650 cfs year-round — 2.5× what the natural river gave in its driest tenth of Septembers, and more than five times its driest year. Across sixty-five years of gaged record the river below Keno carried more than the natural lakes would have in 51 of 65 years, and in dry years — below-average through critically dry — about 184,000 AF a year more. The re-timing that stores winter water is the same thing that carries the river through the summer.

None of this settles what salmon need. Flow is one variable among temperature, dissolved oxygen, disease and habitat, and the reach below Keno has changed in ways no reconstruction captures. What the record does establish is the baseline: the river the salmon evolved with ran very low, very late, in the years that resemble the ones now in dispute.

In the lake. Upper Klamath Lake is the home water of the c’waam and koptu — the Lost River and shortnose suckers — sacred to the Klamath Tribes and listed as endangered since 1988. They spawn in the springs and tributaries and live their long lives in the lake itself, so their water is the same water the Project stores. The July-to-September minimum elevation, the measure that governs how much lake is left them at the end of summer, averaged 4,139.21 ft before 1992 and 4,138.33 from 2001 to 2023. It has risen since: 4,139.30 in 2025.

K.I.D.’s investment in efficiency — SCADA, measurement and control at the headworks and along the canals — is lowering the District’s draw on the lake, leaving more water in that habitat. That is a contribution, not a solution: the District can change what it takes, but not what arrives.

Defend the water

What the record shows

K.I.D. represents its patrons where their water rights are decided. That case rests on evidence: sixty-five years of Reclamation’s own measured inflow, the U.S. Geological Survey’s gage record at Keno, and a reconstruction of what the basin did before the Project existed.

What “natural” means on this page. One reconstruction, used everywhere below. It takes Reclamation’s own measured daily net inflow to Upper Klamath Lake and routes it the way the basin worked before the Project — over the Link River reef, across a Lower Klamath Lake of open water and tule marsh that evaporated much of it, and over the Keno reef at 4,083.1 ft. It is not a forecast and not an ideal; it is what the same water would have done without the works. Every “natural” figure on this page — this year’s and all 65 — comes from it.

Sixty-five years of the natural river at Keno

The same reconstruction, run on Reclamation’s measured daily Upper Klamath Lake net inflow for every water year from 1961 to 2025. Each bar is one water year; the red line is what the gage actually recorded.

  • Passed over the Keno reef under natural conditions
  • Consumed by Lower Klamath Lake before reaching Keno
  • Actually carried past the Keno gage
  • Shutoff years, 2001 and 2021
  • Year type on the Klamath County drought index — wet to critically dry
  • Lost River Slough losses are inside the pale blue — too small to draw, in the tooltip
Median natural year733,840AF over Keno
Driest year, 2021308,340AF over Keno
Jul–Sep median685 cfsnatural summer flow
Lost River Slough4,788AF a year out of the basin, 65-yr mean

Net inflow is Reclamation’s measured daily record for Upper Klamath Lake, water years 1961–2025, with no gaps; its 65-year mean of 1,052,524 AF is the basin’s own long-term supply. Each water year opens the natural lake at the stage the previous year ended. Precipitation is credited on the open water and on the wetted share of tule marsh — the same surface the evapotranspiration is charged against — distributed across the year on the Tulelake gage record — 79 complete years, 1932 to 2024, averaging 10.62 inches. Water lost out of the basin through the Lost River Slough is counted in the pale blue portion but is not drawn separately: it averages 4,788 AF a year and reaches 46,254 AF at most, under 2% of even the tallest bar. Hover any year for the split. Year type follows the categories used in K.I.D.’s ESA review — wet W2–W4, average D1–W1, below average D2, drought D3, critically dry D4 — assigned to the most severe category reaching a quarter of Klamath County on the standardized precipitation index during the water year. Measured flow is the U.S. Geological Survey daily record for gage 11509500, summed by water year; its monthly means reproduce the figures USGS published in SIR 2006–5212 to within 3%.

What the natural year looked like, day by day vs Reclamation’s 2024 Proposed Action

The same 65 reconstructed water years, stacked on one calendar and set against what Reclamation’s 2024 Proposed Action would deliver at the same gage.

  • The median natural year
  • 2024 Proposed Action, median month
  • Middle 40% of the natural years
  • Its 10th to 90th percentile
  • Middle 80% of the natural years

The natural river peaked in May and fell away through the summer — the months the Project now carries.

Median peak, early May2,349 cfsnatural flow at Keno
Median low, late autumn401 cfsnatural flow at Keno
Driest day on record102 cfsacross all 65 years
May against September4.2×median seasonal swing

Each day is summarised across all 65 reconstructed water years. Proposed Action figures are Table 3-6 of the 2024 Klamath Project Operations Biological Assessment (14 June 2024), simulated outcomes at the Keno gage with pulse flows on. That table reports exceedance percentiles, so its 90% column is a low flow and is plotted against the natural 10th percentile.

How much of the Klamath at the Pacific came past Keno

Above, the median month at both gages in cubic feet per second — how much came past Keno, how much the lower basin added below it, and what the reconstruction says Keno would have carried with the natural lakes standing. Below, the same comparison expressed as a share of the whole river.

  • Flow past Keno
  • Joins the river below Keno
  • Keno under natural conditions
  • Keno’s share, as measured
  • Under natural conditions, same years
  • Middle half of the measured years
  • Middle half of the natural years

Two U.S. Geological Survey gages: Keno at the foot of the Project, and Klamath River near Klamath, nine miles above the mouth. Each line is the median of the individual years, each band the middle half of them.

September, as measured27.4%of the river at the ocean came past Keno
January, as measured5.8%of the river at the ocean came past Keno
Across the year8.5%against 9.8% under natural conditions
September, natural17.6%against 27.4% as measured

The upper basin matters least when the river is high and most when it is low. In January the Klamath at the ocean runs near 32,000 cfs and Keno contributes under 6% of it; by September the river has fallen to about 3,200 cfs and Keno is more than a quarter. Keno’s own flow barely moves across the year — 672 to 2,489 cfs — because Upper Klamath Lake and its springs hold it steady, while the rain-fed Trinity, Salmon and Scott swing more than tenfold. Against natural conditions the late-season share is far higher: 27.4% in September where the reconstruction gives 17.6%, and 22.6% in August against 18.5%. From April through July the natural share was the higher of the two — and in July markedly so, 21.6% against 12.2% — because the natural river still had its snowmelt in those months while the Project is filling storage. The Project is not the only work on this river. Copco 1 from 1918, Copco 2 from 1925, J.C. Boyle from 1958 and Iron Gate from 1962 all stood between Keno and the ocean until they came out. Removal ran through Water Year 2024, when flows in the reach were drawn down and redirected for instream work, so that year reflects construction rather than either a dammed or a free-flowing river. The lower basin also carries its own diversions and storage. Those works do not affect the Keno gage, which sits above them, but they shaped the river the Keno flow is being measured against. The difference between the two lines here should be read as the whole developed system against natural conditions, not as the Klamath Project by itself. Both records are daily means; the mouth series reproduces the average the U.S. Geological Survey published for 1910–26 to within 0.1%.

What the Project does, by the kind of year it is

Every water year from 1961 to 2025, sorted by its type on the Klamath County drought index, comparing what the river actually carried past the Keno gage against what the reconstruction says the natural lakes would have passed. Positive means the Project put more water in the Klamath River than nature would have. Each type is split at Water Year 2001, when Project operations changed under the biological opinions.

All 65 years+199,944AF a year over Keno more than natural
Years above natural51 of 65on the USGS gage record
Before 2001+288,905AF a year — 36 of 40 years positive
2001 onward+57,605AF a year — 15 of 25 years positive

Every kind of year comes out positive, and every one of them was larger before 2001. The Project put more water past Keno than the natural lakes would have in 51 of 65 years; the exceptions are concentrated in the recent drought and in the wettest years, when the natural lakes would have spilled nearly everything. The surplus exists because the natural system lost roughly a quarter of a million acre-feet a year to Lower Klamath Lake before the water ever reached Keno, in wet years and dry alike — drain the lake and that water arrives instead. Measured flow is the U.S. Geological Survey daily record for gage 11509500, 38,781 approved daily means, summed by water year.

River, lake and farms, through five regulatory eras

The same three measures under each governing document since the Klamath Project operated on contracts alone. The river is how much more the Keno gage carried than the natural lakes would have passed. The lake is the July–September minimum elevation of Upper Klamath Lake. The farms is the spring and summer draw on that lake by agriculture, measured against what it drew in the twenty-five years its demand was met in full. That benchmark is set separately for each kind of year, because a dry year needs more from the lake: 349,456 AF in critically dry years against 296,842 in wet ones. It is the lake’s share of a fully supplied year, not the whole demand — the rest was offset by Lost River water, precipitation on the crop, and return flows. Fall and winter demand is separate again.

All three fall together, and that is the point. Between the contract era and the 2013–2019 opinion the river’s gain over natural dropped 92%, the lake’s summer minimum fell more than a foot, and agriculture’s draw fell from 99% of its need to 89% — then to 51% under the 2020 opinion. No use gained at another’s expense.

Where the water went. Under contracts, more water passed Keno than entered Upper Klamath Lake — 1,106,824 AF against 1,062,404 — and farms took another 314,309 on top of that. The difference came from Lost River water imported into the reach, drainage returning through the Klamath Straits, and storage drawn down: about 359,000 AF a year that the Project put into the river without taking it from the lake. By the 2020 opinion that figure was 8,000. The water was not reallocated between farms and fish. The Project stopped moving it twice.

Reading the farm strip. The benchmark is what agriculture actually drew from the lake in the 25 years it was not curtailed, set separately for each kind of year because a dry year needs about 18% more from the lake than a wet one — 349,456 AF against 296,842. Each era is measured against the mix of years it contained. These figures are the lake’s share of a fully supplied spring and summer, not total demand; the rest came from Lost River water, rain on the crop, and return flows. Fall and winter demand is separate, and refuge deliveries are excluded throughout. Since 2001 the shortfall against the benchmark totals 1,567,380 AF, with 537,917 AF paid to fallow ground.

A caution on the last bar. The 2020 opinion’s era runs 2020–2024, and Water Year 2024 was a construction year: the four hydroelectric dams below Keno came out that year, and flows in the reach were drawn down and redirected for instream work. That year is neither a dammed river nor a free-flowing one, and it moves this panel more than any other single year. Excluded, the river’s gain over natural for the era rises from +53,567 to +102,173 AF — it nearly doubles. The other two measures move the other way: the lake’s summer minimum falls from 0.74 to 0.63 ft above 4,138, and agriculture’s draw from 52% to 45% of need. The year is left in because removing it would be choosing which figures to improve.

What is left out. The 2024 opinions, covering Water Years 2025 through 2029, are not shown: one water year has closed under them, and Reclamation’s delivery model does not extend past 2024, so two of these three measures would be empty. Single-year opinions are omitted too — in 2001 agriculture received 78,281 AF, 22% of what a critically dry year needs from the lake, while the river’s gain over natural was +357,768 AF, indistinguishable from the contract era.

What happened in the one year that has closed. In Water Year 2025 the river below Keno ran 205,338 AF under what the reconstruction says the natural lakes would have passed — 1,032,944 measured against 1,238,282. That reads like a bad year for the river. It was the opposite. After six years in which there was never enough to go round, the basin used its first full supply to put water back: 50,315 AF down the Ady Canal to the refuges, 27,811 AF over Anderson-Rose Dam into Sump 1A, and 37,585 AF added to storage in Upper Klamath Lake, which finished the year 0.15 ft higher than it began. That is 115,711 AF, more than half the shortfall, and it does not count Tule Lake deliveries or the ground flooded that had not seen water since 2019. The river carried less because the basin chose to refill what six dry years had drained.

And the water moved both ways that year. Against the 115,711 AF put back, the Project returned 191,634 AF to the Klamath — 88,295 from the Lost River, 70,396 through Station 48, and 32,943 through the F and FF pumps. A single net figure hides that; the year was not a withdrawal but a large gross movement in both directions.

Current Water Year Update The District’s read on this season — supply, the wait list, and what’s being done about it Read the update →
Move the water

Water Year 2026, as it is running

K.I.D. exists to acquire, maintain, assure and deliver an adequate water supply. This is the season as it stands — what the basin has produced, where it has gone, and the conditions the Project is operating in today.

Read the year right

Three calendars, one basin

The Klamath year runs on three different clocks, and they are easy to mix up — a lake level in October and a delivery figure in July belong to different periods. Here is what each one is, and where its dates come from.

Hydrologic clock
Water Year
Oct 1 – Sep 30

The accounting year, named for the year it ends — WY 2026 runs Oct 1 2025 to Sep 30 2026. Every supply and accountability number on this page runs on this clock.

USGS / Reclamation convention
Legal season
K.I.D. water right
Mar 1 – Oct 31

The season of the District’s right to divert and use water. A fixed legal period — it does not flex with the weather.

K.I.D. adjudicated right
Operational period
Irrigation season
≈ late Apr – mid Oct

When water is actually delivered to fields — starting when conditions require it after Mar 1 (about the third week of April in an average year) and running to early October (usually about the 15th). Its edges move year to year, and it sits inside the water right.

District operations · conditions-driven
Oct 1 · water year rolls over WATER YEAR 2026 · OCT 1 – SEP 30 WATER RIGHT · MAR 1 – OCT 31 IRRIGATION · ≈ LATE APR – MID OCT ONDJFMAMJJASO

The irrigation season nests inside the water right; the water year is the separate accounting clock. Because it rolls over on October 1, the water right’s season ends in a different water year than it began — which is why an October lake level and a July delivery are counted in different years.

01 · Right now

Live conditions across the Project

Read straight from the federal monitors, refreshed each time this page loads. Every tile opens its official source.

02 · Where it comes from

The supply, and the lake it sits in

The year’s water arrives as mountain snow, melts into Upper Klamath Lake, and is drawn down through the season. The lake is also the home water of the c’waam and koptu — so how full it runs is both a supply question and a habitat one.

Upper Klamath Lake elevation
Daily lake level · Reclamation datum · past 12 months · USGS 11507000
Full chart ↗
Loading live data from USGS…
Peak water stored in Upper Klamath Lake
measured to 4,136.0 ft, incl. 2025 carryover · peaked Apr 5, 2026
573,848AF
Open-water evaporation off the lake
AgriMet Agency Lake (AGKO) · as of Aug 18, 2026
0.25in/day

K.I.D. is lowering its draw on the lake

The District is investing in water-management efficiency — SCADA and related monitoring and control tools — that sharpen how K.I.D. moves and measures water. Delivering the same supply with less loss reduces the District’s demand on Upper Klamath Lake, and water not drawn is water left in the lake — the habitat the c’waam and koptu depend on.

Basin snowpack · water-year to date
Open full snow plot at NRCS ↗
Basin precipitation · water-year to date
Open full precipitation plot at NRCS ↗
04 · How it’s managed

The management, in full

The accounting behind the story: cumulative inflow to the lake, actual outflow over Keno, and the same reconstructed natural flow charted day by day further down — routed through the natural Upper and Lower Klamath Lakes on Reclamation’s own parameters. Drawn from K.I.D.’s daily tracking file.

Net inflow to UKL — projected
Outflow over Keno — projected
Natural at Keno — reconstructed
Actual against natural
Deferred Project Supply · WY 2026Reclamation · as of Aug 13, 2026
47,430 AFProject return flows sent downriver to support targeted Keno flows
Lost River Diversion Channel 31,440 AF · F/FF pumping 15,990 AF
Building the accountability chart…

Reading the dashed line. The dashed line is the reconstructed natural flow at Keno, accumulated day by day — the same reconstruction charted as daily flow further down. It crosses the actual line in late winter and stays above it: nature would have delivered most of the year’s water in the winter and spring melt, then run dry. The Project holds that water back, which is why the red line trails through spring, and releases it through the irrigation season, which is why the gap closes again by late summer.

How the Project changes the Klamath River
daily cfs · net inflow to Upper Klamath Lake, shown as a 10-day mean because it reaches Keno only after two natural lakes have damped it, with actual flow at Keno against reconstructed natural flow · two-lake routing on Reclamation’s own natural outflow rating and Natural Flow Study Part 2 lake parameters
Building the routing…
cfsnet inflow to U.K.L., 10-day meanactual at Kenonatural (reconstructed)held in storageadded to the river
Conserve the water

The basin the water runs through

K.I.D. promotes the conservation of water, soil and other natural resources. These are the conditions the species the law protects are meeting, the District’s own investment in efficiency, and the drought and fire picture the whole basin is living in.

03 · The listed species

The fish, in the water they live in

Two protected species, two different waters. Salmon are an introduced presence downriver, meeting the conditions the Project passes at Keno; the c’waam and koptu live in the lake above, adapted to summers that would harm salmon. The colour flags rate each live reading against standard salmon thresholds — they apply to salmon only.

Upper Klamath Lake vs Keno · live water quality
the water entering the Project vs leaving it
Water temperature
Upper Klamath Lake °F
At Keno °F
Dissolved oxygen
Upper Klamath Lake mg/L
At Keno mg/L
pH
Upper Klamath Lake
At Keno
Un-ionized ammoniac’waam & koptu · not live
UKL documented peak~300 µg/L
Suckers’ lethal530–780 µg/L
Salmon suitabilitysuitablemarginalharmfulthe ammonia row is a separate sucker measure
Keno conditions over the year, for salmon
daily max temperature & daily min oxygen · past 12 months · USGS 11509500
Loading live data from USGS…
Salmon conditionsuitablemarginalharmfulbars show the condition of the water, not the presence of fish
Days Keno crossed each salmon threshold
water year 2026 to date · live from USGS 11509500
Water temperature
Rearing & growth stressdaily max above ~64°F days
Adult migration impairedabove ~70°F · migration season days
Lethaldaily max near 77°F days
Dissolved oxygen
Stress & avoidancedaily min below ~6 mg/L days
Serious harmdaily min below ~5 mg/L days
Lethaldaily min near 3.3 mg/L days
05 · The backdrop

The year’s drought & wildfire

The conditions the whole basin is managing against. The Drought Monitor updates each Thursday; the Windy map is live.

Method and sources

How these numbers were made

Every figure above comes from a published record or a stated calculation. What follows is where each came from, what the reconstruction assumes, and what it does not settle.

How the reconstruction works

The dashed line is the Klamath River at Keno as it would run with no Project — daily inflow routed through the two natural lakes and over their rock reefs.

1 · Upper Klamath Lake

Inflow is routed on Reclamation’s own rating of outflow “in a state of nature” over the Link River reef.

2 · Lower Klamath Lake

Parameters from Reclamation’s Natural Flow Study, Part 2: 34,994 acres of open water and 55,842 acres of marsh, the Keno reef at 4,083.1 ft, and overflow to the Lost River Slough above 4,085 ft, rated to reach 1,200 cfs at the natural high-water stage of 4,087.8 ft. The lake can recede to the reef crest, where outflow falls to nothing.

3 · Starting condition

Not assumed: the same model was run through WY2025 on Reclamation’s daily record, and every trial opening from 4,083.1 to 4,085.0 ft converges to 4,084.01 ft by 30 September 2025 — a wet year fills the lake to the reef-controlled level and erases what came before. Jacobs (1906) and Voorhees (1913) both record the reef holding near 4,084 ft even at low water.

4 · Evaporation and marsh transpiration

Applied to the wetted area — open water plus however much of the marsh the lake stage has flooded. Depths are measured: 3.69 ft a year off open water and 3.08 ft off marsh, by eddy covariance and Bowen-ratio energy balance at Upper Klamath Lake (USGS SIR 2013–5014, with Reclamation). Those depths are then scaled by this year’s reference ET at Reclamation’s AgriMet station at Worden, measured against Worden’s own long-term normal: stored factor. Day-to-day distribution: stored daily profile.

5 · Rain on the lake, credited back

Evaporation is only half the exchange. Rain falling on the same wetted surface is added to the balance: 0.885 ft a year, the mean of 79 complete years at the Tulelake gage, the nearest station on the basin floor. Across a typical year that is about 75,000 AF credited against roughly 284,000 AF of gross evapotranspiration — an offset of just over a quarter — leaving a net loss near 208,000 AF, or 2.4 ft off the lake. Precipitation is credited on exactly the surface the evaporation is charged against, so the two terms rise and fall together as the marsh floods and drains.

6 · Why the rain does not save the summer

The offset is real but arrives at the wrong time. 63% of the year’s rain falls between October and March and only 10% from July to September, while evaporation runs the other way. The credit lands when the lake is already full and spilling over the reef, and is nearly absent through the drawdown that set the natural river’s summer low. Adding it raises the annual total more than it lifts the September flow.

7 · Where wind sits in this

Wind is not modelled separately because it is already inside the depths. Both figures come from eddy covariance and Bowen-ratio energy balance — instruments that measure the actual turbulent transport of water vapour off the surface, so the wind of the measurement years is carried in the flux itself, not estimated from it. Year-to-year variation enters through one term: this year’s reference evapotranspiration at Reclamation’s Worden station against Worden’s own long-term normal, which moves with wind, temperature, humidity and radiation together. The limit is that this is a single annual factor. A windy summer and a calm one get the same daily distribution, and a 10% swing in evaporative demand would move the lake’s net loss by roughly 28,000 AF — about 14% of that term. Resolving wind daily would need a Worden record reaching back to 1961, which does not exist.

8 · Why the marsh draws all season

The reef holds the water table at the root zone — USGS SIR 2013–5014 found the bulrush root zone saturated year-round with the water surface more than a foot below ground. The model treats the marsh as 75% wetted at the reef stage, which reproduces Part 2’s stated 188,000 AF annual loss.

9 · The loss is not an assumption

Paired USGS gage records on the Link River and at Keno, 1908–1913, with Lost River imports removed, show the natural lake consuming roughly 200,000–300,000 AF a year before the water reached Keno — and that is already with the Slough diked shut and the railroad dike across the lake, so it understates the wholly natural condition.

Reading the shading
Winter and spring — the Project holds back water the natural river would have carried away in a pulse.
Late season — the Project puts water into the river the natural lakes would have evaporated. Part 2 puts that mid-summer loss above 700 cfs.
The projected band

Right of the divider, projected to 30 September: net inflow held at its recent average, evaporation tapering into autumn, and Keno held at the 750 cfs and 790 cfs figures used in this year’s operating projection, with a 7,000 acre-foot ceremonial release.

What this model assumes. The reconstruction has to start the two natural lakes somewhere on 1 October. Reclamation’s own gage sheets settle the upper lake: it stood at 4,140.30 ft entering the wet year of 1916–17 and 4,140.25 ft entering the dry year of 1917–18 — the reef holds the autumn level near 4,140.25 whatever the preceding year was like. The lower lake is less well constrained. Starting levels set how much carried-over storage is available to release, and the annual totals are sensitive to them, so the cumulative comparison of actual against natural is not published here.

06 · Go to the source

Every reading, at its official monitor

Live conditions read from USGS and Open-Meteo. Supply, accountability, and natural-flow figures from K.I.D.’s daily tracking file. Draft — under District and legal review.